While working on my first production-level project, I encountered some performance issues. The web application was not as fast and when I checked the Lighthouse ratings, it was quite bad. Before that, I had not taken the importance of a good Lighthouse score seriously. As it was in the production environment, I decided to deep dive into the workings of a browser, and learn how we can leverage its capabilities to improve the performance of our application. Here is a simplified version of a browser’s working.
How did it start?
Whenever you click on a link on the browser or enter an address, it first looks for the IP address of the server in the system cache. If it is not in the cache, then it proceeds to request the DNS(Domain Name Server). Once IP is received, it is stored in cache for future use. Note that, this is a simplified explanation of what happens. In reality, this is even more complex and there are many other facets to it.
TCP handshake

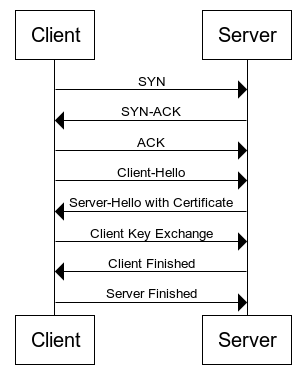
When IP is received, then the client/browser sends an SYN (Synchronize) request to the server. When a server receives an SYN request, it responds with an SYN-ACK (synchronize acknowledge) message. The computer then responds with an ACK (acknowledge) message that establishes a connection between the two systems. This is known as a TCP three-way handshake.
For secure connections over HTTPS, an extra step called SSL/TLS Handshake takes place. It consists of three more message exchanges before the actual content is transferred. During that, both the systems verify each other, determine the cipher to be used for data encryption and establish a secure connection.
 UML diagram of initial message exchanges between browser(client) and server
Finally, The Request
After all these steps, the browser sends the GET request to the server which is mostly an HTML file. According to that, the server responds with an HTML file. The initial response of the server is of 14kb size and then the size is gradually increased until the network’s maximum bandwidth is determined or congestion is experienced. With every packet received, the client sends the ACK message.
As soon as the browser receives the first response, it starts parsing the data. It starts building DOM(Document Object Model) and CSSOM(CSS Object Model), which are internal representations of HTML markup and CSS respectively.
 Simplified flow diagram of how webpage display steps
The DOM building process:
The DOM consists of nodes which is a representation of a tag. It starts building as the HTML is being parsed. The node starts with a start-tag and ends with an end-tag. If any tag comes within a tag, it creates nested nodes. The number of the DOM nodes affects the time it takes to render the page. Be cautious of divitis(too many nested/unnecessary div elements), because they can lead to performance issues.
How can you optimize the HTML?
Compression and minification
Make it concise, by not using inline CSS and removing unnecessary white spaces and comments
Prioritize the resources, load the critical ones early, and render-blocking at a later stage.
The Preload Scanner
While the DOM tree is being built, the preload scanner quickly goes through the page content and makes requests to the external resources like images, CSS style-sheets, fonts, etc. This is helpful because, by the time the main HTML parser comes to an asset, it is already downloaded or being retrieved. This reduces overall loading time.
JavaScript Compilation
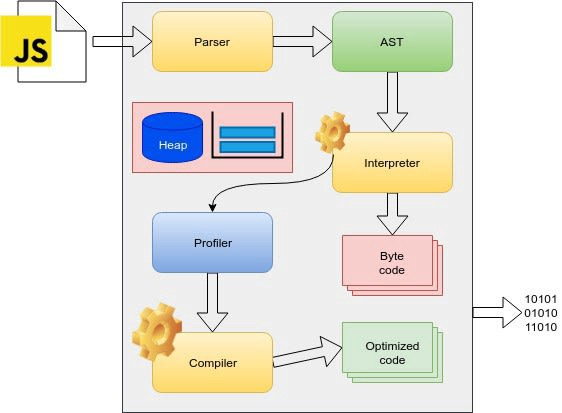
Whenever parser encounters JavaScript, it is passed to the JavaScript Engine. In the engine, it is first converted into an Abstract syntax tree. The tree is then passed to the interpreter, which generates the non-optimized bytecode which is executed. While execution, the compiler optimizes the part of bytecode that is non-optimized or hot. This is called a Just in Time compilation. V8, SpiderMonkey, JavaScriptCore are some of the famous JavaScript engines.
 Working of Chrome V8 Engine
How to optimize JavaScript Code?
Remove unused code
Compress and minify it
Lazy load the non-critical code
The CSSOM building process:
The CSSOM building process is render-blocking, which means the browser blocks the rendering until all the CSS is processed and CSSOM is built. The browser traverses through every CSS rule and generates nodes with children inheriting the styles of the parent. Unlike HTML, the CSS rules are not incremental, because with higher specificity the rules of children can be easily overridden.
Why should CSS comes first and JavaScript be last?
If the CSSOM and DOM are built, it will at least show something to the user as a visual cue for the loading of the page. If we put JavaScript first it will block the render and nothing will show until it is parsed. Many times JavaScript is used to override CSS rules. If the CSSOM is not built before JavaScript’s execution, it might cause an error as there’s nothing to override. Similarly for DOM, if JavaScript is executed before the building of the DOM tree, it will not get the DOM nodes to work on, which can cause errors. That is why it makes more sense to put JavaScript at the last and CSS at first.
How can you optimize CSS?
Compress and minify it
Fetching CSS based on viewport size by using media attribute of link tag
Render Tree
When both DOM and CSSOM tree is ready, the render tree is built by combining both. This is done by checking every DOM node and determining which styles are to be applied to it. The render tree does not contain non-visible content, such as the head tag and its descendants, nodes with display property as none. But the nodes with visibility hidden are included.
Layout
The layout is the process where the size and position of each render tree node. The browser starts with the root node of the render tree and determines the location and size of every node while considering the viewport size of the device. Subsequent calculations of size and dimensions are called reflow.
Paint

Paint refers to the actual coloring of the device pixels based on all the data generated in previous steps. In this step, the browser draws all the visual elements of a node on the screen. Usually, this step is carried on the CPU thread, but it gets transferred to the GPU in case of elements such as video or canvas, which are heavy to process. The transfer can also be done using CSS styles like transform, will-change, and opacity. When the element is painted via GPU, it gets broken into layers. It is important to ensure that they are arranged/mapped in the right order so that the element is rendered correctly. This is known as compositing.
In the case of deferred JavaScript, it gets executed when the initial paint(first meaningful paint) is done, i.e. on DOMContentLoaded the event. If deferred JavaScript is big, it will increase the “TTI”, i.e Time to Interactive. It is the time it takes for the webpage to be interactive since the first request. Ideally, it should be within 4–5 seconds. As the main thread is busy executing JavaScript, the user interactions are not handled and the page appears to be clogged which, in turn, increases the TTI. So, it is important to keep deferred JavaScript minimal.
The above-mentioned processes can occur again if the JavaScript changes the DOM or CSSOM nodes. If you have visited Lighthouse or Performance tabs in Developer tools, you may be able to see the terms like Re-composting and repaint. These are the subsequent processes that occur if there is some change to the DOM due to JavaScript.
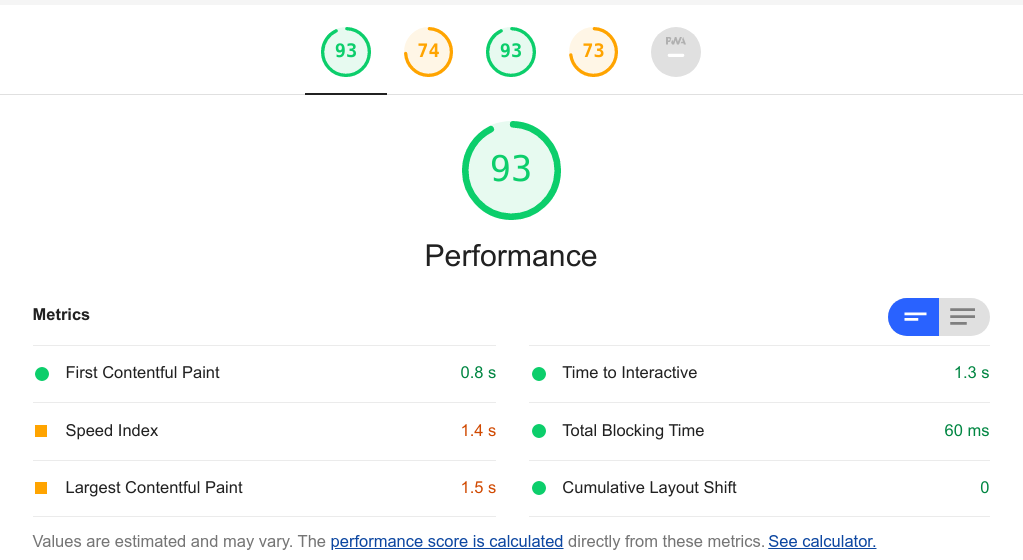
 Chrome Lighthouse
So, in all, this is how browsers generally work. I hope you have understood.
Thanks for reading!
At Scalereal We believe in Sharing and Open Source.
So, If you found this helpful please give some claps 👏 and share it with everyone.
Sharing is Caring!
Thank you ;)
