
In the last blog, we explored the integration part and some of the basic features of Google Maps Javascript API. If you haven’t read it, check the below link 👇️
Integration of Google Maps with React | Part 1
Now let’s explore some of the advanced features of Google Maps Javascript API.
Handling the zoom level of the map
We have already seen in the previous blog how to set the default zoom level by passing the zoom property to the GoogleMap component and the dynamic zoom level of the map by using the fitBounds method inside the onLoad function.
Now let’s see how we can handle the zoom level on user actions.
Use the setZoom method from Maps Javascript API inside the callback function to handle the zoom level on user actions as described in the below code snippet.
Local States
- mapRef: Stores the reference of the map component, using which you can access all the predefined methods of the map.
Callback functions
onLoad on GoogleMap component (onLoad):
Set the reference of the map component
Set a default view of the map
onClick on Marker component (handleMarkerClick):
Set the clicked marker at the center position of the map by providing the latitude and longitude to the panTo method.
Set the new zoom level by using the setZoom method.
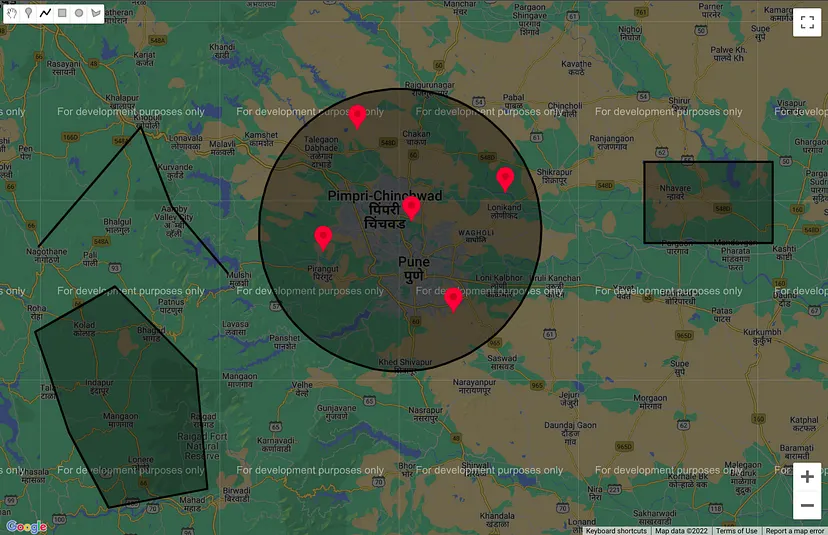
Drawing Tool
The DrawingManager component from Maps Javascript API provides a graphical interface for users to draw polygons, rectangles, polylines, circles, and markers on the map.
The Drawing Tools are a self-contained library separate from the main Maps API JavaScript code. To use the functionality contained within this library, you must first load it using the useLoadScript hook as described below.
Once you load the drawing library and render the DrawingManager component under GoogleMap, you will find drawing options in the top left corner of the map.
The DrawingManager component takes a set of options that define the set of controls to display, the position of the control, and the initial drawing state. That means you can customize the drawing tool by passing the options to the drawing manager.
drawingManagerOptions = {
  drawingControl: true,
  drawingControlOptions: {
    position: google.maps.ControlPosition.TOP_CENTER,
    drawingModes: [
        google.maps.drawing.OverlayType.MARKER,
        google.maps.drawing.OverlayType.CIRCLE,
        google.maps.drawing.OverlayType.POLYGON,
        google.maps.drawing.OverlayType.POLYLINE,
        google.maps.drawing.OverlayType.RECTANGLE
    ]
  },
  polylineOptions: {
    strokeColor: 'black',
    strokeWeight: 5,
    editable: false,
    zIndex: 1,
    geodesic: true
  }
}
- drawingControl: defines the visibility of the drawing tools selection interface on the map.
- drawingControlOptions: defines the position of the control and the types of overlays that should be represented in the control.
- Each type of overlay can be assigned a set of default properties, that define the appearance of the overlay when first created. These are defined in that overlay’s {overlay}Options property (where {overlay} represents the overlay type).
- For example, a circle’s fill properties, stroke properties, zIndex, and clickability can be defined with the circleOptions property.
Geofencing
A geofence is a virtual perimeter (fence) defined around a specific geographic location.
We can work with the geofence to carry out various operations when an object with internet connectivity, like a mobile phone or a car enters or leaves such an area.
For example, we can notify customers when a delivery driver is near their home, match a user with the nearest rideshare driver, or send customers to the closest store location.
Suppose there is a set of coordinates that forms a route/path on the map, and you want to define a boundary (geofence) for that specific path. To create a geofence, you need to find area boundaries and draw those on google maps as a polygon using the Polygon component from Maps Javascript API as described in the below code snippet.
- onLoad function is responsible for creating area boundaries that act as a geofence for the specified route.
- The polygon component takes a set of options that helps you to customize the polygon.
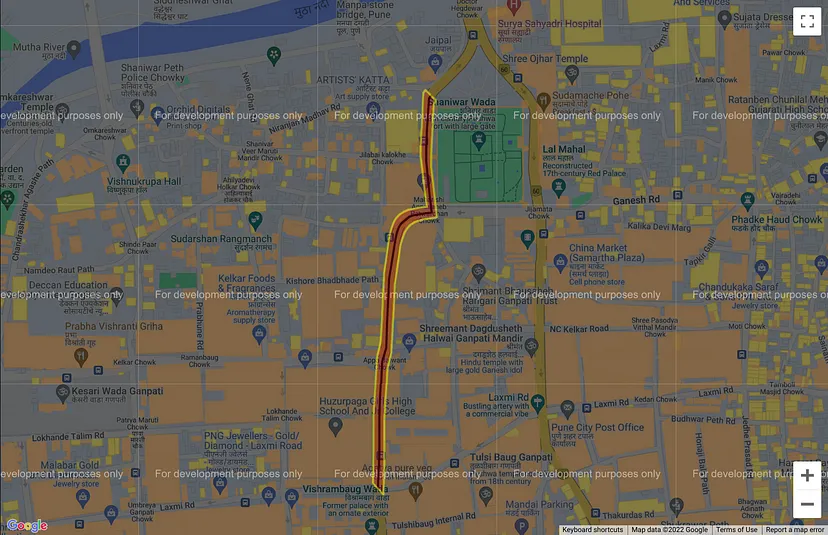 Output
- As you can see in the output, the black line represents a route, and the yellow border represents the geofence.
Customizing Map Styles
You can fully customize your Google Maps styles as per your application theme. Google Maps allows you to customize colours, roads, labels, landscapes and many other things.
Follow the below steps to customize map styles:
- Login to your Google Developer Console dashboard
- Select your project
- If you don’t find the Map Styles option in the left-side menus, search for Map Styles in the search box and select the Map Styles option from the Products & Pages category.
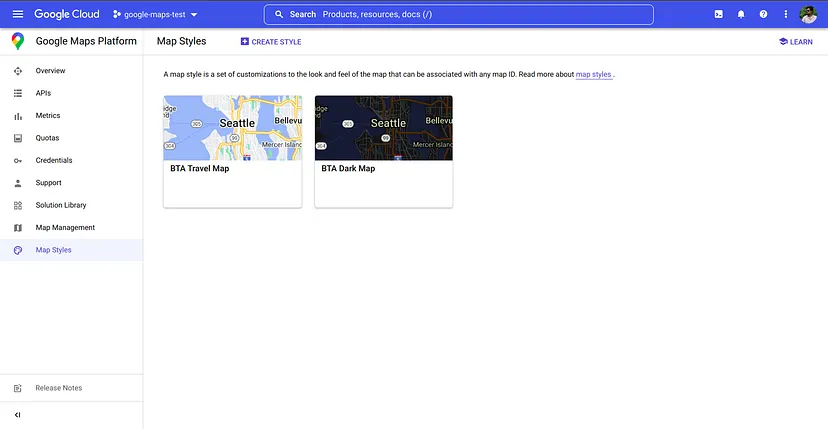
- Click on Create Style
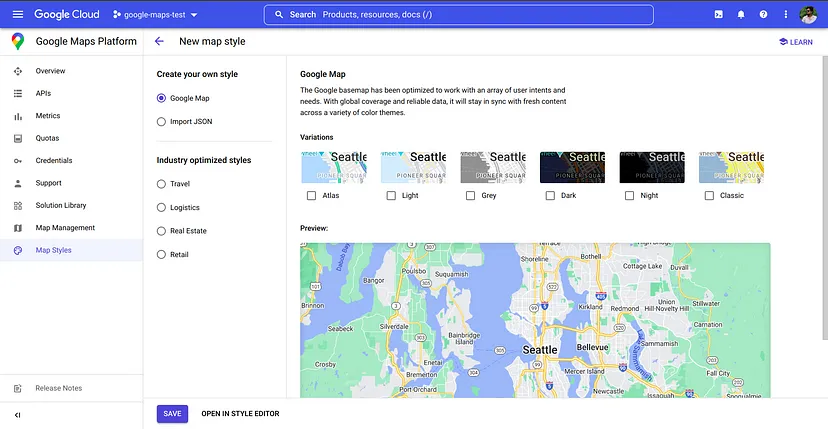
- Then you can select any variation from the default ones, or you can create your own styles by clicking on the Open Style Editor option
- Navigate to Map Management after saving your custom styles
- Click on the Create Map ID option.
- Provide Name, Description and Map type (Javascript — Vector) and click on the Save button
- Then select the Map style that you created earlier from the dropdown options and Save
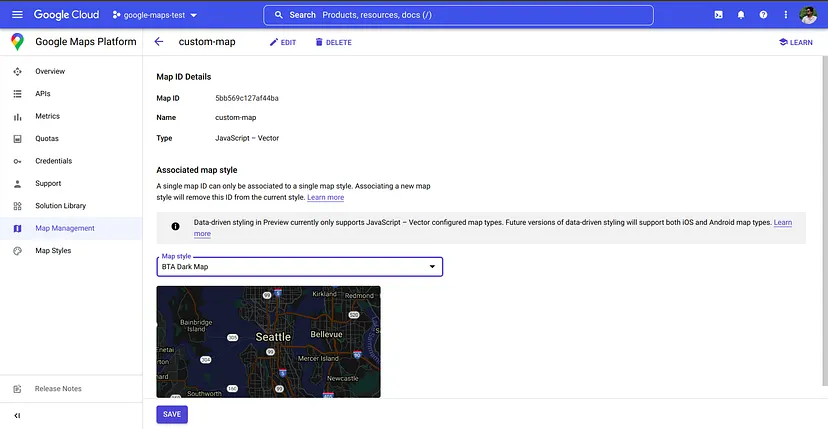
- Copy the Map ID and pass it to the GoogleMap component as described below
<GoogleMap
  mapContainerClassName="map-container"
  center={{ lat: 18.518056173723338, lng: 73.85410993103704 }}
  zoom={10}
  onLoad={onLoad}
  options={{mapId: 'YOUR_MAP_ID'}}
/>
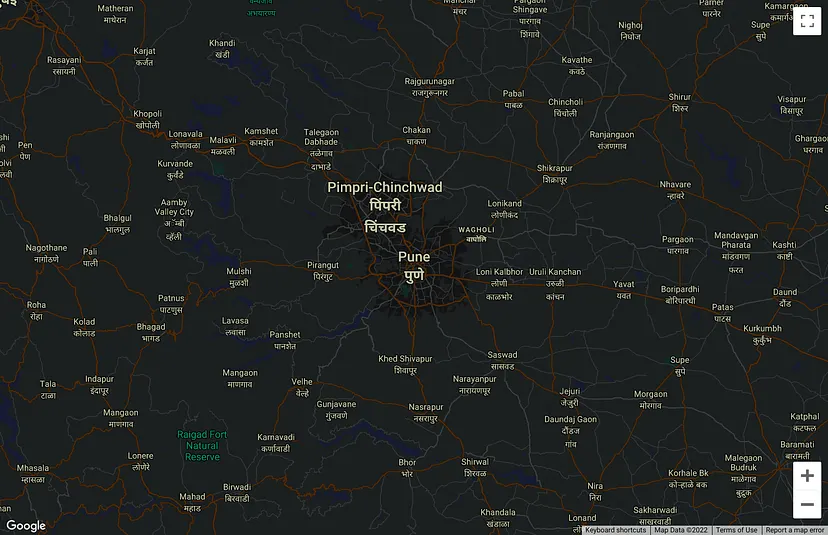 Output
In this way, you can also get rid of the tag For development purposes only.
In this blog, we have covered advanced features of Maps Javascript API with examples. For more details check out our GitHub repository here.
At Scalereal We believe in Sharing and Open Source.
So, If you found this helpful please give some claps 👏 and share it with everyone.
Sharing is Caring!
Thank you ;)